Original Version is located here:
http://bjr.birjournals.org/cgi/content/full/76/909/617
This annotated version has been entered into acamedia cache on May 3, 2007.


British Journal of Radiology (2003) 76, 617-624
© 2003 British Institute of Radiology
doi: 10.1259/bjr/52526261
J. Gruber's Annotated Version of
Visualization of prostate cancer using dynamic contrast-enhanced MRI: comparison with transrectal power Doppler ultrasound
H Ito, MD1,
K Kamoi, MD, PhD2,
K Yokoyama, MD, PhD3,
K Yamada, MD, PhD1 and
T Nishimura, MD, PhD1
1 Department of Radiology, Graduate School of Medical Science, Kyoto Prefectural University of Medicine, 465 Kajii-cho Kawaramachi-dori Hirokoji Kamigyo-ku Kyoto, 602-8566, 2 Department of Urology, Kyoto Prefectural University of Medicine and 3 Department of Pathology and Cell Regulation, Kyoto Prefectural University of Medicine, Kyoto, Japan
 |
Abstract
|
|---|
This study was designed to assess the efficacy of dynamic contrast-enhanced MRI (DCE-MRI), in comparison with power Doppler ultrasound (PDUS), for visualizing prostate cancer. 111 men suspected of having prostate cancer underwent imaging before undergoing octant biopsy. Subsequently, 31 cancer-positive patients were enrolled in this study. DCE-MRI was obtained using a three-dimensional fast-field echo sequence, which assured wide coverage of the prostate gland. The transrectal PDUS were scored according to the degree of power Doppler flow signals. The time intensity curve types for the DCE-MRI and the PDUS scores were compared with the histopathologic results for each region. The time intensity curves were correlated significantly with PDUS scores (p<0.001). Using PDUS, the overall sensitivity, specificity and accuracy of cancer visualization in peripheral zones were 69%, 61% and 66%, respectively. Using DCE-MRI, the corresponding values were 87%, 74% and 82%. In the inner gland, using PDUS, the overall sensitivity, specificity and accuracy were 68%, 94% and 83%, respectively. Using DCE-MRI, the corresponding values were similar (68%, 86% and 78%). DCE-MRI was significantly more sensitive than transrectal PDUS in peripheral zones (p<0.05). In conclusion, both transrectal PDUS and DCE-MRI can be used to demonstrate hypervascularity in many prostate cancers. DCE-MRI was significantly more sensitive than PDUS for visualizing of prostate cancers without loss of specificity in the peripheral zone.
|
Introduction
|
|---|
MRI is a good modality for staging prostate cancer owing to its excellent demonstration of zonal anatomy and the relationship of the prostate gland to surrounding structures in the pelvic cavity [1, 2]. With MRI, the diagnosis of prostate cancer depends primarily on the signal intensity of T2 weighted images. This approach is limited by a low specificity for the detection and localization of prostate cancer [3–5]. Transrectal ultrasound (TRUS) is widely used not only for detecting prostatic diseases, but also for guided prostate needle biopsies [6, 7]. Using TRUS, prostate cancer can be visualized as a hypoechoic lesion in the peripheral zone; however, lesions can also appear echogenic or isoechoic. Thus, TRUS alone is not adequate for diagnosis of prostate cancer [8].
Recent studies have shown that prostate cancers are visible as hypervascular lesions on colour Doppler ultrasound (CDUS) and power Doppler ultrasound (PDUS), and preliminary reports have suggested an improvement in cancer detection using these techniques [9–16]. However, the role of Doppler techniques in prostate cancer diagnosis is still under evaluation [17]. Therefore, all patients with abnormal findings on a digital rectal examination (DRE) and high serum levels of prostate-specific antigen (PSA) will eventually undergo a systematic biopsy.
Dynamic contrast-enhanced MRI (DCE-MRI) is known to be a powerful tool for visualizing the vascularity of solid tumours such as breast and musculoskeletal tumours [18, 19]. In recent studies, DCE-MRI of the prostate gland has also been shown to provide additional information that is useful for both the detection and the staging of prostate cancer [20–24]. However, previous series on the use of DCE-MRI for cancer localization were technically limited in that only a single slice or at best a few slices, were used based on the findings of T2 weighted images. Thus, this technique only allowed part of the entire volume to be visualized, leading to a degree of operator-dependent bias in slice selection.
In this study, we hypothesised that most prostate cancers were hypervascular and could be visualized with DCE-MRI and PDUS as hypervascular lesions. We used transrectal PDUS and DCE-MRI with a three-dimensional (3D)-gradient echo sequence, assuring broad coverage of the prostate gland and high temporal resolution, for patients suspected to have prostate cancer.
The purpose of this study was to assess the use of DCE-MRI for the visualization of prostate cancer and to compare the DCE-MRI findings with PDUS and histopathologic results.
|
Methods and subjects
|
|---|
111 men, suspected to have prostate cancer based on high PSA values (greater than 4.0 ng ml-1) or abnormal DRE findings, underwent PDUS, DCE-MRI and TRUS-guided systematic octant biopsy. The study began in November 2000 and was completed in September 2001. All patients underwent DCE-MRI and PDUS prior to a TRUS-guided systematic octant biopsy.
Prior to the biopsy, the risks and benefits of the biopsy procedure were explained to each patient, and written informed consent was obtained. An experienced urologist performed the octant biopsy under TRUS-guidance using a transperineal approach with an automatic spring-loaded 18-gauge biopsy gun (Bard, Atlanta, GA) and a biplanar probe. An octant biopsy consists of 3 biopsies from each side of the medial, lateral and far-lateral peripheral zones and 1 biopsy from each side of the inner gland. All biopsy cores were labelled to identify the biopsy location and all specimens were evaluated by one experienced uropathologist who had no knowledge of the clinical findings.
The biopsy specimens of 31 patients (28%) were positive for cancer; these patients form the cohort of this study. The patients ranged in age from 53 years to 89 years old (mean, 72.3±7.2 standard deviation (SD)). The prostate gland regions were classified into four sites;
- right and left peripheral zones and
- right and left inner glands.
We reviewed 62 peripheral zone sites and 60 inner gland sites in this study (2 inner gland sites of 1 patient were excluded because of a previous transurethral prostate resection).
Power Doppler ultrasound protocol
Conventional TRUS and transrectal PDUS were performed before the biopsy by one urologist using an ultrasound machine (SSD-5500, Aloka, Tokyo, Japan) and an endorectal biplanar (convex 5 MHz and linear 7.5 MHz) probe. The Doppler gain was adjusted to a point below the range at which no background signals were observed. Scanning to detect flow was continued for 10 min in each patient, and the examination consisted of a standard sequence of axial images from apex to base. A hypervascular lesion was defined as a focal or diffuse intensely vascular area of the prostate gland; all classifications were performed on a consensus basis by two experienced urologists, who were unaware of the DCE-MRI findings. Hypervascular lesions detected by PDUS were graded for both right and left peripheral and inner gland sites on a scale of 0 to 2, according to the degree of Doppler signals (DS):
- no remarkable accumulation was graded as DS0,
- slight accumulation DS1, and
- intense accumulation as DS2.
DS0 was defined as negative and DS1–2 as positive results [16].
MRI protocol
In all patients, the DCE-MRI examination was performed 1 or 2 days before the systematic octant biopsy. All images were obtained using a 1.5 T superconducting MR system (Gyroscan Intera, Philips Medical Systems, Best, The Netherlands) with a 5-channel phased array coil. After obtaining three plain localizer images, T2 weighted turbo spin-echo images were acquired in the axial plains using the following parameters: (4700/120/17 [repetition time (TR), ms/echo time (TE), ms/echo train length]) four signal excitations; axial T1 weighted images (500/9/5), two signal excitations; and sagittal T2 weighted images (4700/120/17). All examinations were performed using a 4 mm section thickness, a 0.4 mm intersection gap, a 200 mm field of view and a 256 x 256 matrix. A right-to-left phase-encoding direction was used to decrease motion artefacts from the abdominal wall. The DCE-MRI was obtained using a 3D-fast field echo sequence in the axial plain (4.5/1.5/30 [TR/TE/flip angle]) with a 50 mm slab thickness and 10 partitions, a 200 mm field of view and a 64 x 128 matrix. In most patients, the scan slab allowed a full coverage from the apex to the base of the prostate gland.
After a bolus injection (3 ml s-1) of 0.1 mmol of gadopentetate dimeglumine (Magnevist, Nihon Schering, Osaka, Japan) per kilogram body weight using an auto injector (SPECTRIS, Nihon Medrad, Osaka, Japan) with a 15 ml saline flush, dynamic MRIs were obtained every 3 s for 3 min. In total 600 DCE-MRI images were obtained.
Finally, post-contrast fat suppressed T1 weighted turbo spin-echo images (500/9/5) were obtained using two signal excitations.
Dynamic MRIs were transferred to a diagnostic workstation (EasyVision, Philips Medical Systems, Best, The Netherlands) and dynamic MR analysis software was used for the evaluation. First, multislice dynamic MRIs were displayed in cine mode with subtraction from the first scan image for every slice position. For both the right and left peripheral zones, one slice was selected if a strongly enhanced lesion, as compared with the surrounding tissue, was observed. A region of interest (ROI) was placed and traced on the enhanced lesion on a consensus basis by two radiologists who were aware only of the PSA and DRE findings and were not involved in obtaining the TRUS or PDUS findings. Despite knowledge of PSA and DRE findings, we selected ROIs with only subtracted images. If a strongly enhanced lesion was not visible, a slice through the middle of the gland was selected and a ROI was placed over the area encompassing both peripheral zones. For the right and left inner glands, a slice through the middle of the gland was selected and ROIs were placed over the area encompassing both sides of the inner gland because there was inhomogeneous enhancement from coexisting benign prostatic hyperplasia (BPH) in many cases.
A time–intensity curve (TIC) for each site was obtained from the dynamic images. TICs were classified into three types, based on their shapes (Figure 1 ). The time-to-peak was defined as the delay time between the point on the curve of enhancement at which the signal was above the noise level and signal peak of TIC. The Type A TIC was characterized by an early peak enhancement and a time-to-peak value of no more than 60 s. The Type B TIC was characterized by an intermediate early enhancement and a time-to-peak value of no less than 60 s, and not greater than 100 s. The Type C TIC was characterized by delayed enhancement and no signal peak after a continuous increase in signal intensity for 3 min.

View larger version (17K):
[in this window]
[in a new window]
|
Figure 1. Schematic illustration of time–intensity curve classifications for dynamic contrast-enhanced MRI. Type A is characterized by early peak enhancement (within 60 s), Type B by intermediate-early enhancement (60–100 s) and Type C by delayed enhancement with no signal peak obtained after a continuous increase in intensity for 3 min.
|
|
- For the peripheral zone sites, we defined
- Type A and B TICs as positive and
- Type C TIC as negative on DCE-MRI.
Most normal peripheral zones did not show hypervascularity.
- As to the inner gland sites, normal inner glands and coexisting BPH often showed moderate vascularity. Thus, we defined
- only Type A TIC as positive and
- Type B and C TICs as negative on DCE-MRI.
Statistical analysis
- True-positive sites were defined as those showing hypervascularity on DCE-MRI or PDUS, and histopathologically positive for cancer.
- True-negative sites were defined as those not showing hypervascularity on DCE-MRI or PDUS, and histopathologically negative for cancer sites.
The DCE-MRI TIC classification and the Doppler signal score were compared with the histopathologic results. The chi-square test (without Yates correction), Fisher's exact probability test and the Spearman rank order correlation were used for the categorical comparison of data. The comparison between DCE-MRI and PDUS was made with the McNemar chi-square test. All statistical analyses were performed on a personal computer using Statview for Windows (Version 5.0, SAS institute Inc., NC).
|
Results
|
|---|
[Histopathological cancer-positive patients]
- For 31 cancer-positive patients, the serum PSA level was known and exceeded 4.0 ng ml-1 (range 4.1–302 ng ml-1, mean, 43.7 ng ml-1, median, 11.4 ng ml-1).
- DRE findings were positive for 20 patients and negative for 11 patients.
- Patients were comprehensively assessed for tumour stage with DRE, TRUS and non-contrast MRI and
- localized cancer was diagnosed in 13 patients (T1 or T2) and
- non-localized cancer in 18 patients (T3 or T4).
- Gleason scores ranged from 2+1 to 5+4.
62 peripheral zone sites and 60 inner gland sites were evaluated.
- 39 peripheral zone sites and
- 25 inner gland sites
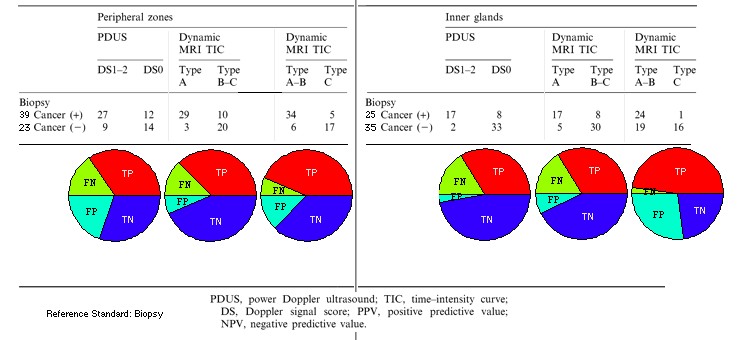
were histopathologically cancer positive (Table 1).
In both the peripheral zones and inner glands, many hypervascular sites demonstrated with PDUS and DCE-MRI were cancer positive histopathologically. Representative cases are shown in Figures 2 and 3.
- In the first example, the patient was suspected of having prostate cancer because of a high serum PSA level and a positive DRE (Figure 2).
- In the second example, the patient was suspected of having of prostate cancer because of a borderline increase in his serum PSA level (Figure 3).
View this table:
[in this window]
[in a new window]
|
Table 1. Comparison of power Doppler ultrasound (Doppler signal, DS), dynamic contrast-enhanced MRI (TIC) and histopathologic (biopsy) results
|
|

View larger version (82K):
[in this window]
[in a new window]
|
Figure 2. A 72-year-old man suspected to have prostate cancer based on a high serum prostate-specific antigen (36.9 ng ml-1) level and a positive digital rectal examination. The systematic octant biopsy results were positive in the left peripheral zone and left inner gland. Gleason score=4+4. (a) Transrectal ultrasound (left) and power Doppler ultrasound (right) of the prostate gland. Hypoechoic foci are demonstrated in the left peripheral zone (arrows) and the left inner gland (arrowhead). An intensely abnormal Doppler signal is observed in hypoechoic foci. The Doppler signal in the far right lateral peripheral zone is a neurovascular bundle (asterisk). (b) T2 weighted turbo spin echo image (4700/120) shows a low intensity lesion in the left peripheral zone (arrows) and left inner gland (arrowhead). (c) Early dynamic contrast-enhanced MRI shows strong enhancement in the low signal intensity lesion. (d) Regions of interest are superimposed on the source image of the left peripheral zone and left inner gland hypervascular lesions. (e) Time–intensity curves from the right and left peripheral zones. The left peripheral zone shows early, intense enhancement and was classified as Type A. The right peripheral zone shows delayed enhancement with no signal peak and was classified as Type C. The periodic fluctuations in the signal intensity curves are derived from respiratory motion artefacts produced by the abdominal wall.
|
|

View larger version (81K):
[in this window]
[in a new window]
|
Figure 3. A 71-year-old man suspected to have prostate cancer based on a border-line elevation of prostate-specific antigen (9.6 ng ml-1) Only one biopsy core was positive in the right peripheral zone. Gleason score=4+4. (a) Transrectal ultrasound (left) and power Doppler ultrasound (right) of the prostate gland. No abnormal echoic lesions are visible. An intensely, focal abnormal Doppler signal is observed in the apex of the right peripheral zone (arrow). The Doppler signal in the ventral part of the prostate gland is an anterior prostatic venous plexus (asterisk). (b) T2 weighted turbo spin echo image (4700/120) shows an equivocal low intensity lesion in the apex of the right peripheral zone (arrow). (c) The source image of dynamic contrast-enhanced MRI shows focal early enhancement in the right-sided apex (arrow). (d) Region of interest is superimposed on the source image for the right apex hypervascular lesion. (e) The time intensity curve from the lesion shows early, intense enhancement and was classified as Type A. The time intensity curve of the left peripheral zone shows delayed enhancement with no signal peak and was classified as Type C.
|
|
Correlation of PDUS score and DCE-MRI TIC classification
The DCE-MRI TIC classifications and PDUS scores are summarized in Table 1 . The DCE-MRI TIC classifications were correlated significantly with the PDUS scores in both the peripheral zones and the inner glands (p<0.001, Spearman Rank-Order Correlation).
Correlation of PDUS findings and histopathologic results
The PDUS findings and histopathologic results are summarized in Tables 2 and 3. 36 peripheral zone sites were positive for PDUS and 26 sites were negative.
- Of the 36 positive PDUS sites, 27 sites had positive biopsies.
- Of the 26 negative PDUS sites, 14 had negative biopsies.
Cancer-positive sites correlated significantly with PDUS-positive sites (chi-squared=5.4, p=0.02). The overall sensitivity, specificity, accuracy, positive predictive value (PPV) and negative predictive value (NPV) for cancer visualization in the peripheral zones were 69%, 61%, 66%, 75% and 54%, respectively. 19 inner gland sites were positive for PDUS and 41 sites were negative. Of the positive PDUS sites, 17 had positive biopsies. Of the negative PDUS sites, 33 sites had negative biopsies (p<0.001, Fisher's exact probability test). The overall sensitivity, specificity, accuracy, PPV and NPV for cancer visualization of in the inner glands were 68%, 94%, 83%, 89% and 80%, respectively.
View this table:
[in this window]
[in a new window]
|
Table 2. Sensitivity, specificity and accuracy for tumour visualization in peripheral zones and inner glands. Reference Standard: biopsy
|
|
View this table:
[in this window]
[in a new window]
|
Table 3. Sensitivity (TP), specificity (TN) for tumour visualization in peripheral zone and inner glands. Reference Standard: biopsy
|
|
Correlation of DCE-MRI findings and histopathologic results
The DCE-MRI TIC classifications and histopathologic results are summarized in Tables 2 and 3. Cancer-positive sites correlated significantly with DCE-MRI positive sites (p<0.001, Fisher's exact probability test). The overall sensitivity, specificity, accuracy, PPV and NPV in the peripheral zones were 87%, 74%, 82%, 85% and 77%, respectively. The overall sensitivity, specificity, accuracy, PPV and NPV in the inner gland zones were 68%, 86%, 78%, 77% and 79%, respectively. When Type A and B TICs were defined as positive for the inner gland, sensitivity improved (68% to 96%) but the specificity was substantially reduced (86% to 46%).
Comparison between DCE-MRI and PDUS for visualization of the cancer
In the peripheral zone,
- the sensitivity, specificity and accuracy of DCE-MRI were greater than PDUS for cancer visualization.
- 9 positive sites on DCE-MRI were negative on PDUS among the histopathologically confirmed cancer sites.
- 2 negative sites on DCE-MRI were positive on PDUS among the histopathologically confirmed cancer sites.
- Statistically, DCE-MRI was significantly more sensitive than PDUS (chi-squared=4.45, p<0.05, McNemar chi-squared test) without loss of specificity.
For the inner gland,
the sensitivity, specificity and accuracy of DCE-MRI and PDUS were comparable.
There was no statistically significant difference between DCE-MRI and PDUS for the inner gland.
|
Discussion
|
|---|
MRI is considered to be a good modality for imaging prostate cancer, especially for local staging [1, 2]. This technique depends primarily on the difference in signal intensity between the cancerous and normal peripheral zones of the prostate. However, the tumour visualization achieved with this technique is unsatisfactory because normal tissues as well as pathologic processes can produce areas of hypointensity in the peripheral zone [1, 3–5]. The use of gadolinium-enhanced MRI has been described in the literature, but information on this technique remains limited [25, 26]. A study by Brown et al [20] was successful in evaluating the vascularity of prostate cancer using the early phase of DCE-MRI. Several other DCE-MRI series have also shown that cancers tend to enhance earlier and more strongly than the normal peripheral zone [21–24, 27]. Previous DCE-MRI provided additional information on cancer localization and extraprostatic extensions, as compared with the results of non-contrast enhanced MRI and conventional contrast-enhanced MRI techniques. However, most of these recent studies were performed after a biopsy had been performed and involved only a single slice, several slices at most, that had been selected based on T2 weighted images.
Hypervascularity in prostate cancer has also been demonstrated using transrectal colour or power Doppler ultrasound, and the distribution of Doppler signals provides information in addition to that obtained from the grey-scale image of conventional TRUS. Several studies have evaluated the usefulness of CDUS and PDUS for the detection of prostate cancer and guidance in target biopsies [9–16]. However, the role of Doppler imaging in the detection of prostate cancer is still under assessment [17].
Prior to the systematic biopsies undergone by all of the patients in this study, we performed DCE-MRI using a 3D fast-field echo sequence, with low spatial resolution in order to achieve broad coverage of the prostate gland and high temporal resolution. The location of the imaging slab was determined without the information from T2 weighted images. This method allowed the region-by-region correlations between PDUS and DCE-MRI findings. Our results indicate that the DCE-MRI TIC classifications are correlated significantly with the PDUS scores. Thus, DCE-MRI might be comparable with PDUS in assessing lesion vascularity. More than two-thirds of the cancer positive sites exhibited hypervascularity on both PDUS and DCE-MRI. Using DCE-MRI, the cancer positive sites exhibited earlier and more intense enhancement than the cancer negative sites. Previous results concerning the detection of cancer in peripheral zones using CDUS found sensitivity to be low, and therefore inadequate for cancer screening [28]. In this study, the sensitivity of prostate cancer visualization in peripheral zones was high and significantly greater with DCE-MRI than with PDUS (DCE-MRI vs PDUS; 87% vs 69%). The specificity of DCE-MRI in the peripheral zones was also better than that of PDUS (DCE-MRI vs PDUS; 74% vs 61%).
The visualization of prostate cancers arising from the inner glands is difficult because coexisting BPH may produce a signal intensity similar to that of cancer nodules with marked vascularity [4, 23, 29]. In the inner gland, the sensitivity of DCE-MRI was equivalent to that of PDUS (DCE-MRI vs PDUS; 68% vs 68%), but specificity did not exceed that of PDUS (DCE-MRI vs PDUS; 86% vs 94%). When Type A and B TICs were defined as positive, sensitivity improved (68% to 96%) but specificity was substantially reduced (86% to 46%). It would appear that these unfavourable results might have been affected by the hypervascularity of the normal inner gland and coexisting BPH. On the other hand, PDUS interpretations were made with knowledge of the normal vascular appearance of the gland [10]. Thus, hypervascularity of the normal inner gland and BPH may not be judged as PDUS positive by experienced observers.
Doppler US techniques are convenient for assessing vascularity because they do not require contrast media and can serve as an integral adjunct to conventional TRUS. However, Doppler ultrasound is operator-dependent, and examiner experience affects evaluation of the Doppler signal [17].
On the other hand, DCE-MRI is less operator-dependent, and high-temporal resolution DCE-MRI can be used to detect the first-pass of a contrast agent, providing quantitative modelling parameters. Turnbull et al [29] successfully differentiated prostate cancer from BPH using a two-compartment simplex minimization technique. Engelbrecht et al [30] evaluated new curve fitting methods that were shown to provide more accurate estimations of pharmacokinetic parameters. Quantitative DCE-MRI might therefore have the capacity to visualize the focus of the cancer within the inner gland of the prostate.
Our study population included patients with all clinical stages, such that a direct pathological correlation with post-surgical resections and quantitative analysis could not be obtained. The anatomical localization method of DCE-MRI and PDUS was based on only four sites. The localization of the apex-to-base axis was not considered. If tumours were highly heterogeneous and infiltrative, a ROI may have been placed incorrectly. Despite these limitations, our results suggest that both PDUS and DCE-MRI can be used to demonstrate hypervascularity in many prostate cancers. DCE-MRI was significantly more sensitive than PDUS for visualizing prostate cancer independent of T2 weighted images in peripheral zones. The combination of conventional MRI and DCE-MRI might be useful for differentiating a cancer focus from other low intensity lesions in the peripheral zone.
In patients with a negative DRE, TRUS and a high serum PSA level, DCE-MRI might play an important role in localizing the cancer, allowing a target biopsy to be performed and thereby reducing the number of biopsy sites. Patients with a negative initial biopsy who have a persistently elevated serum PSA may undergo additional repeat biopsies to detect a "missed" cancer. While repeat biopsies improve the detection rate, they also increase the costs of treatment and are accompanied by incremental risks of haemorrhage and infection. MR spectroscopy is known to be useful for detecting cancer in such patients [31]. DCE-MRI of the prostate using the new techniques described in this study may also play a role in the follow up of these patients.
In conclusion, both PDUS and DCE-MRI can be used to demonstrate hypervascularity in many prostate cancers. DCE-MRI was significantly more sensitive than PDUS for visualizing prostate cancers with out loss of specificity.
Received for publication May 23, 2002.
Revision received March 27, 2003.
Accepted for publication June 24, 2003.
|
References
|
|---|
- Schiebler ML, Schnall MD, Pollack HM, Lenkinski RE, Tomaszewski JE, Wein AJ, et al. Current role of MR imaging in the staging of adenocarcinoma of the prostate. Radiology 1993;189:339–52.[Abstract]
- Jager GJ, Ruijter ET, van de Kaa CA, de la Rosette JJ, Oosterhof GO, Thornbury JR, et al. Local staging of prostate cancer with endorectal MR imaging: correlation with histopathology. AJR Am J Roentgenol 1996;166:845–52.[Abstract/Free Full Text]
- White S, Hricak H, Forstner R, Kurhanewicz J, Vigneron DB, Zaloudek CJ, et al. Prostate cancer: effect of postbiopsy hemorrhage on interpretation of MR images. Radiology 1995;195:385–90.[Abstract]
- Schiebler ML, Tomaszewski JE, Bezzi M, Pollack HM, Kressel HY, Cohen EK, et al. Prostatic carcinoma and benign prostatic hyperplasia: correlation of high-resolution MR and histopathologic findings. Radiology 1989;172:131–7.[Abstract]
- Quint LE, Van Erp JS, Bland PH, Mandell SH, Del Buono EA, Grossman HB, et al. Carcinoma of the prostate: MR images obtained with body coils do not accurately reflect tumor volume. AJR Am J Roentgenol 1991;156:511–6.[Abstract/Free Full Text]
- Lee F, Torp-Pedersen ST, Siders DB, Littrup PJ, McLeary RD. Transrectal ultrasound in the diagnosis and staging of prostatic carcinoma. Radiology 1989;170:609–15.[Abstract]
- Hodge KK, McNeal JE, Stamey TA. Ultrasound guided transrectal core biopsies of the palpably abnormal prostate. J Urol 1989;142:66–70.[Medline]
- Mettlin C, Lee F, Drago J, Murphy GP. The American Cancer Society National Prostate Cancer Detection Project. Findings on the detection of early prostate cancer in 2425 men. Cancer 1991;67:2949–58.[CrossRef][Medline]
- Rifkin MD, Sudakoff GS, Alexander AA. Prostate: techniques, results, and potential applications of color Doppler US scanning. Radiology 1993;186:509–13.[Abstract]
- Neumaier CE, Martinoli C, Derchi LE, Silvestri E, Rosenberg I. Normal prostate gland: examination with color Doppler US. Radiology 1995;196:453–7.[Abstract]
- Kelly IM, Lees WR, Rickards D. Prostate cancer and the role of color Doppler US. Radiology 1993;189:153–6.[Abstract]
- Okihara K, Kojima M, Naya Y, Iida A, Watanabe M, Watanabe H. Ultrasonic power Doppler imaging for prostatic cancer: a preliminary report. Tohoku J Exp Med 1997;182:277–81.[CrossRef][Medline]
- Cho JY, Kim SH, Lee SE. Diffuse prostatic lesions: role of color Doppler and power Doppler ultrasonography. J Ultrasound Med 1998;17:283–7.[Abstract]
- Sakarya ME, Arslan H, Unal O, Atilla MK, Aydin S. The role of power Doppler ultrasonography in the diagnosis of prostate cancer: a preliminary study. Br J Urol 1998;82:386–8.[Medline]
- Franco OE, Arima K, Yanagawa M, Kawamura J. The usefulness of power Doppler ultrasonography for diagnosing prostate cancer: histological correlation of each biopsy site. BJU Int 2000;85:1049–52.[CrossRef][Medline]
- Okihara K, Kojima M, Nakanouchi T, Okada K, Miki T. Transrectal power Doppler imaging in the detection of prostate cancer. BJU Int 2000;85:1053–7.[CrossRef][Medline]
- Halpern EJ, Strup SE. Using gray-scale and color and power Doppler sonography to detect prostatic cancer. AJR Am J Roentgenol 2000;174:623–7.[Abstract/Free Full Text]
- Kuhl CK, Mielcareck P, Klaschik S, Leutner C, Wardelmann E, Gieseke J, et al. Dynamic breast MR imaging: are signal intensity time course data useful for differential diagnosis of enhancing lesions? Radiology 1999;211:101–10.[Abstract/Free Full Text]
- Verstraete KL, De Deene Y, Roels H, Dierick A, Uyttendaele D, Kunnen M. Benign and malignant musculoskeletal lesions: dynamic contrast-enhanced MR imaging—parametric "first-pass" images depict tissue vascularization and perfusion. Radiology 1994;192:835–43.[Abstract]
- Brown G, Macvicar DA, Ayton V, Husband JE. The role of intravenous contrast enhancement in magnetic resonance imaging of prostatic carcinoma. Clin Radiol 1995;50:601–6.[CrossRef][Medline]
- Jager GJ, Ruijter ET, van de Kaa CA, de la Rosette JJ, Oosterhof GO, Thornbury JR, et al. Dynamic TurboFLASH subtraction technique for contrast-enhanced MR imaging of the prostate: correlation with histopathologic results. Radiology 1997;203:645–52.[Abstract]
- Namimoto T, Morishita S, Saitoh R, Kudoh J, Yamashita Y, Takahashi M. The value of dynamic MR imaging for hypointensity lesions of the peripheral zone of the prostate. Comput Med Imaging Graph 1998;22:239–45.[CrossRef][Medline]
- Padhani AR, Gapinski CJ, Macvicar DA, Parker GJ, Suckling J, Revell PB, et al. Dynamic contrast enhanced MRI of prostate cancer: correlation with morphology and tumour stage, histological grade and PSA. Clin Radiol 2000;55:99–109.[CrossRef][Medline]
- Ogura K, Maekawa S, Okubo K, Aoki Y, Okada T, Oda K, et al. Dynamic endorectal magnetic resonance imaging for local staging and detection of neurovascular bundle involvement of prostate cancer: correlation with histopathologic results. Urology 2001;57:721–6.[CrossRef][Medline]
- Mirowitz SA, Brown JJ, Heiken JP. Evaluation of the prostate and prostatic carcinoma with gadolinium-enhanced endorectal coil MR imaging. Radiology 1993;186:153–7.[Abstract]
- Huch Boni RA, Boner JA, Lutolf UM, Trinkler F, Pestalozzi DM, Krestin GP. Contrast-enhanced endorectal coil MRI in local staging of prostate carcinoma. J Comput Assist Tomogr 1995;19:232–7.[Medline]
- Tanaka N, Samma S, Joko M, Akiyama T, Takewa M, Kitano S, et al. Diagnostic usefulness of endorectal magnetic resonance imaging with dynamic contrast-enhancement in patients with localized prostate cancer: mapping studies with biopsy specimens. Int J Urol 1999;6:593–9.[CrossRef][Medline]
- Newman JS, Bree RL, Rubin JM. Prostate cancer: diagnosis with color Doppler sonography with histologic correlation of each biopsy site. Radiology 1995;195:86–90.[Abstract]
- Turnbull LW, Buckley DL, Turnbull LS, Liney GP, Knowles AJ. Differentiation of prostatic carcinoma and benign prostatic hyperplasia: correlation between dynamic Gd-DTPA-enhanced MR imaging and histopathology. J Magn Reson Imaging 1999;9:311–6.[CrossRef][Medline]
- Engelbrecht MR, Huisman HJ, Laheji RJ, Jager GJ, Van Leenders A, Barentsz JO, et al. Prostate cancer detection using quantitative dynamic contrast-enhanced MR imaging. In: Scientific program of The Radiological Society of North America 87th Scentific Assembly and Annual Meeting. Radiology 2001;221(P):584.
- Kaji Y, Kurhanewicz J, Hricak H, Sokolov DL, Huang LR, Nelson SJ, et al. Localizing prostate cancer in the presence of postbiopsy changes on MR images: role of proton MR spectroscopic imaging. Radiology 1998;206:785–90.[Abstract]
This article has been cited by other articles: (Search Google Scholar for Other Citing Articles)

|
|

|
|
 
H. Li, K. Sugimura, Y. Kaji, Y. Kitamura, M. Fujii, I. Hara, and M. Tachibana
Conventional MRI capabilities in the diagnosis of prostate cancer in the transition zone.
Am. J. Roentgenol.,
March 1, 2006;
186(3):
729 - 742.
[Abstract]
[Full Text]
[PDF]
|
|
|
|
|

|
|

J. J. Futterer, M. R. Engelbrecht, H. J. Huisman, G. J. Jager, C. A. Hulsbergen-van De Kaa, J. A. Witjes, and J. O. Barentsz
Staging Prostate Cancer with Dynamic Contrast-enhanced Endorectal MR Imaging prior to Radical Prostatectomy: Experienced versus Less Experienced Readers
Radiology,
November 1, 2005;
237(2):
541 - 549.
[Abstract]
[Full Text]
[PDF]
|
|
|
|
|

|
|

A R Padhani and C M Nutting
Why do we need more accurate intraprostatic localization of cancer?
Br. J. Radiol.,
September 1, 2003;
76(909):
585 - 586.
[Full Text]
[PDF]
|
|
|