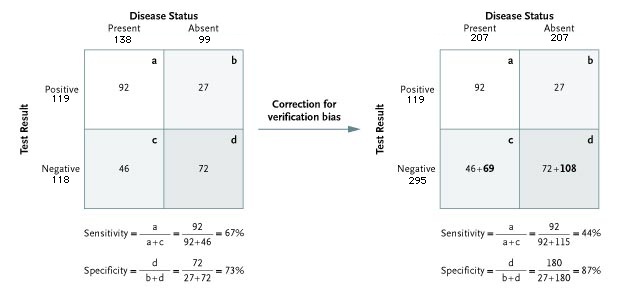
Figure 2. An Example of the Change in Sensitivity and Specificity with Correction for Verification Bias, Based on a Study of Exercise Testing and Confirmation with Coronary Angiography.
Source: Punglia, RS et al., "Effect of Verification Bias on Screening for Prostate Cancer by Measurement of Prostate-Specific Antigen", NEJM 349(4):335-342, July 24, 2003 (in cache)
Verification bias is evident in the two-by-two table on the left. Again, as in Fig. 1, only some of the patients with negative test results (c + d) undergo confirmatory testing, leading to an apparent sensitivity of 67 percent and an apparent specificity of 73 percent.
If fewer patients with negative results undergo confirmatory testing, then patients with false negative results are underrepresented, and the sensitivity in the biased sample is overestimated.
The same correction method is chosen here as in Fig. 1: In the two-by-two table on the right, confirmatory testing in all patients increases the number of patients with negative results by a common factor n. (The numbers of patients not included in the analysis on the left are shown in bold; the numbers of patients in the true-negative (d) and false-negative (c) cells each increase by a factor n = 2.5 over the totals in the respective cells in the left-hand table. The result is an unbiased estimate of the characteristics of the test.)
The unbiased sensitivity decreases to 44 percent and the specificity increases to 87 percent. In each table, the number of true positives is shown in cell A and the number of false negatives in cell C.
Data are from Froelicher et al. and Gianrossi et al.
Froelicher VF, Lehmann KG, Thomas R, et al. The electrocardiographic exercise test in a population with reduced workup bias: diagnostic performance, computerized interpretation, and multivariable prediction. Ann Intern Med 1998;128:965-974.
Gianrossi R, Detrano R, Mulvihill D, et al. Exercise-induced ST depression in the diagnosis of coronary artery disease: a meta-analysis. Circulation 1989;80:87-98.