Comparison of Calculated Population Sizes in the Presence
of Meropenem
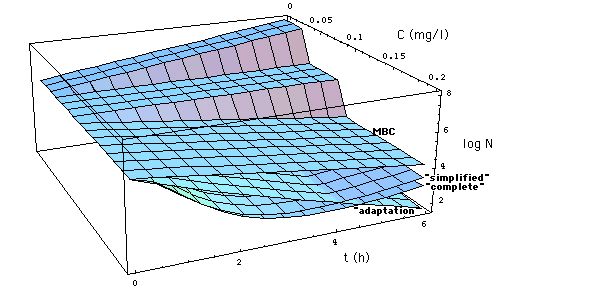
Fig. 4a: Comparison of calculated
S. aureus populations N[C, t] exposed to meropenem concentration C during
time t. Models:
-
MIC model (6, Fig.
1,
MBC = 3 MIC)
-
Emax models
-
"complete" model, eq. (11),
-
"simplified" model, eq. (12),
-
"adaptation" model, eq. (13).
Back
version: 19. Jan. 2004
URL
Home
Joachim
Gruber