Lognormal distributions of PSA levels: evaluation of PSA relevant parameters
Abstract
PSA concentrations depend on whether or not cancer develops in the prostate. In addition to that other parameters have an influence on the PSA concentration, such as the extent of benign prostatic hyperplasia (BPH) and mechanical or hormonal stimulation of the prostate, like bicycling or sexual activity.
In principle, two of the simplest possibilities are: these parameters
- introduce (irregular) noise that obscures the PSA dependence on cancer or
- change the PSA concentration in a systematic way that can be separated from the influence cancer has.
Punglia et al. used the second approach to interpret the influence of BPH on the PSA concentration. In this paper I propose to assess the influence of prostate stimulation in the same way.
Introduction:
Using the lognormal PSA concentration distribution to separate BPH from cancer
Probability Distributions and Receiver Operating Characteristic
Punglia et al. (in cache) showed 2006 that the natural logarithm of total PSA concentrations, x = ln[PSA], is normal-distributed both
- in the population k with cancer and
- in the population g without cancer,
stratified by age group and the presence of benign prostatic hyperplasia (BPH, as tested by the digital rectal exam, DRE).
f is the corresponding probability distribution. By definition the area under f (between -infinity and +infinity) is 1.
The Receiver Operating Characteristic (ROC) is a parametric curve with the total PSA concentration psa as parameter ("threshold"). Points on the ROC curve have the coordinates {TP[psa], FP[psa]}, where TP and FP are the areas under the normal distribution f[x,  ,
,  ] to the right of the threshold x = ln[psa].
- TP[psa] is the corresponding area under fk, the distribution for the population with cancer. ("true positive fraction").
- FP[psa] is the corresponding area under fg, the distribution for the population without cancer ("false positive fraction").
Expressing the ROC in terms of normal distributions
Let the cumulative distribution function Cdf[x, , ] be the area under f between (- infinity) and a threshold x. Then
- FP[x, , ] = 1 - Cdf[x, , ],
where in the Cdf the distribution fg is used,
- TP[x, , ] = 1 - Cdf[x, , ],
where in the Cdf the distribution fk is used.
Since {FP, TP}, and thus the ROC, is the primary information being generated from the medical data (i.e. from PSA measurements and biopsies), the lognormal distributions fg and fk are the result of a numerical fit. Figs. 1 and 3 show how this fit is done, and the result, distributions fg and fk, are shown in the shaded rectangle in the lower left of these figures.
In their Table 3 Punglia et al. specify the parameters of the resulting distributions ( = mean ln[PSA],
= standard deviation). They further subdivided the populations k and g into 2 subpopulations depending on the findings of a digital rectal exam (DRE): DRE normal and DRE abnormal.
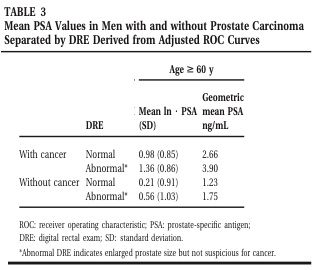
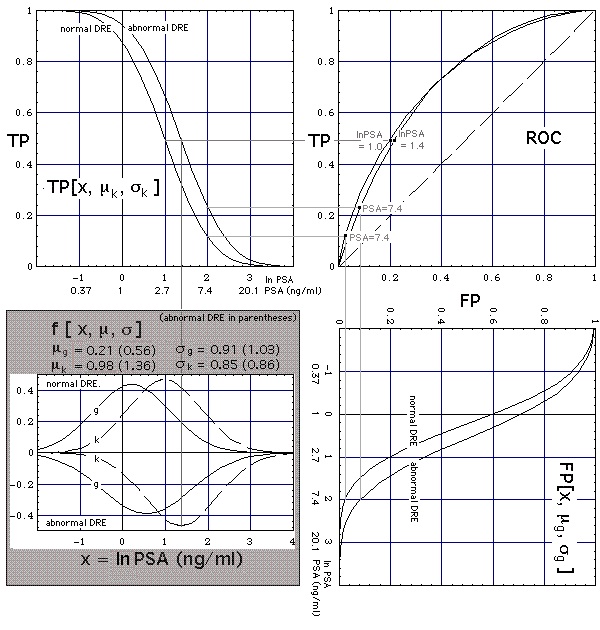
Figure 1. Connection of ROC curves (upper right corner) with lognormal-distributed PSA concentrations (shaded area in lower left corner). In the shaded area distributions for the subpopulation
- with normal (abnormal) DRE are shown in the upper (lower) half of the plot,
- without (with) cancer are represented by the solid (dashed) curves g (k).
Fig. 1 shows: The presence of BPH
- has little effect on the shapes of the solid and dashed curves and their relative positions, and thus on the ROC curve,
- shifts the solid-dashed curve ensemble towards higher PSA levels, thus changing the PSA threshold labels on the ROC curve.
In this sense, the effect of BPH on the PSA concentration is superimposed on the effect of cancer, rather than masking its effect. (Contrary to that, in Nuclear Magnetic Resonance Imaging (MRI) BPH and/or chronic prostatitis are known to mask cancer [Shukla-Dave A et al., "Chronic Prostatitis: MR Imaging and 1H MR Spectroscopic Imaging Observations - Initial Observations", Radiology. 2004 Jun;231(3):717-24 (in cache)]
Using the lognormal PSA concentration distribution to separate mechanical prostate irritation from cancer
Even advanced pre-biopsy prostate cancer diagnostics still relies heavily on measurement of PSA levels [Claus PC, Hricak H and Hattery RR, "Pretreatment Evaluation of Prostate Cancer: Role of MR Imaging and 1H MR Spectroscopy", in cache].
The level of sexual activity has been observed to correlate with tPSA concentrations. The corresponding tPSA elevation can be of about the same size as Punglia et al. showed for cancer. Reducing sexual activity will not readily reduce tPSA levels. tPSA relaxation can take weeks. This exceeds the urologists' recommendation to their patients to be sexually abstinent for several days before PSA measurement.
It is proposed here that the influence of sexual activity on the PSA test be treated similarly as the one of BPH, i.e. as a shift of the lognormal distributions g and k. In the final part of this draft two possibilities will be discussed:
- If sexual activity acts similarly as BPH, its effect on the PSA test can be reduced by adjusting the test threshold.
- If sexual activity leaves the location of the PSA concentration probability distribution for cancer unchanged the PSA test cannot discriminate between sexual activity and cancer.
Data
The size of the shift will be derived from the time series of PSA concentrations plotted in Fig. 2. A transrectal Fine Needle Aspiration Biopsy detected no cancer in that patient.
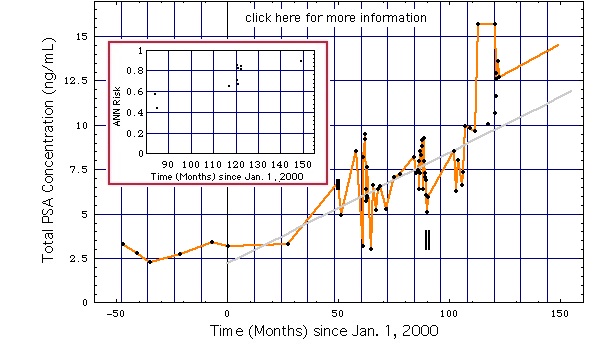
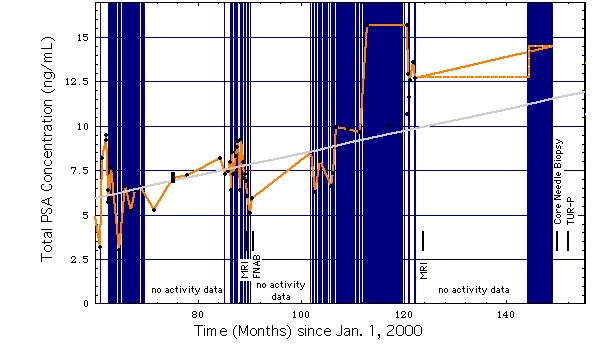
Figure 2:
left diagram: Oscillations of the PSA concentration caused probably by variations of sexual activity (data).
right diagram: Same as left diagram, except for higher temporal resolution and graphical representation of frequency of sexual activity or extended bicycle riding.
Vertical (blue) lines mark days with sexual activity or extended bicycling (i.e. no bicycing/sexual activity on unmarked days). "no activity data" means: during this period sexual activity/bicycling was not recorded.
|
|
Disregarding the rise of the mean PSA concentration with age, the PSA concentrations in Fig. 2 will be approximated by a mean of 5 ng/mL about which it varies by roughly a factor of 2, i.e. from 2.5 ng/mL to 10 ng/mL. This will be used to construct the ROC curves stratified by sexual activity.
Alternatives
In terms of the above given framework the frequency of sexual activity might be thought of as shifting the lognormal PSA distributions but leaving their shapes (given by the standard deviations SD) unaltered. The simplest alternatives are: sexual activity
- leaves the ensemble of both distributions g and k unchanged and shifts its position along the ln[PSA] axis towards higher PSA values, similarly as BPH does (Fig. 3a),
- leaves both the position and shape of distribution k unchanged, but shifts distribution g towards higher ln[PSA] values while leaving its shape unaltered (Fig. 3b).
In Figs. 3 the shape of the lognormal PSA distributions are the ones published by Punglia et al. for normal DRE. Increased sexual activity will be taken into account by shifting corresponding distributions upwards by the mentioned factor of 2. (Note: ln2 = 0.7)
Alternative 1
Let us assume that -as shown in Fig. 3a- sexual activity
- does not change the shapes and positions of the two lognormal distributions g and k relative to each other, thus leaving the "g-k ensemble" unaltered,
- does shift the "g-k ensemble" by a distance lnPSA = 0.7 to the right, which means a PSA level shift by a factor of 2.
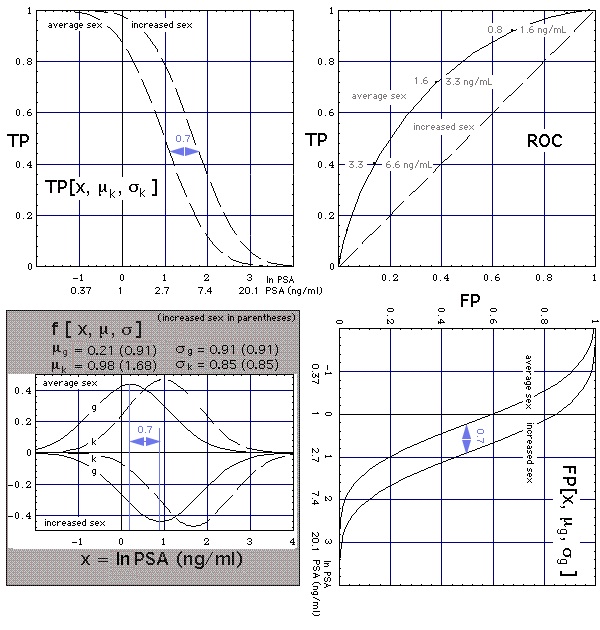 Figure 3a
 Construction of ROC curve (upper right corner) from normal-distributed natural logarithms of PSA concentrations (f curves in shaded area, g means "without cancer", k means "with cancer"). Grey numbers on ROC curve are the PSA thresholds (units: ng/mL), numbers above the ROC curve give the thresholds for the average population, numbers below specify the thresholds for the subpopulation with increaed sexual activity (
Notation).
Parameters used:
Then the
- shape of the ROC curve -meaning the test performance- is independent from sexual activity (thus the ROC curves for average and increased sex coincide), and the
- PSA threshold tags along the ROC curve (grey numbers) increase with sexual activity, in our example by a factor of 2.
An example: Let us choose the point {FP, TP} = {0.13, 0.4} on the ROC. It assigns the test sensitivity TP = 0.4 and test specificity (1 - FP) = 0.87
- to the test threshold x = 3.3 ng/mL for the average population,
- to the test threshold 2 x = 6.6 ng/mL for the subpopulation with increased sex.
Result: For the subpopulation with increased sexual activity the PSA threshold needs to be raised by a factor of 2 as compared to the normal population, meaning in our example: the test gives the same result for a member of the subpopulation having a PSA level above 6.6 ng/ml as for a member of the normal population having a PSA level above 3.3 ng/ml.
Alternative 2
Let us now visualize alternative 2, i.e. sexual activity
- leaves both the position and shape of distribution k unchanged, but
- shifts distribution g by a distance lnPSA = 0.7 towards higher ln[PSA] values while leaving its shape unaltered.
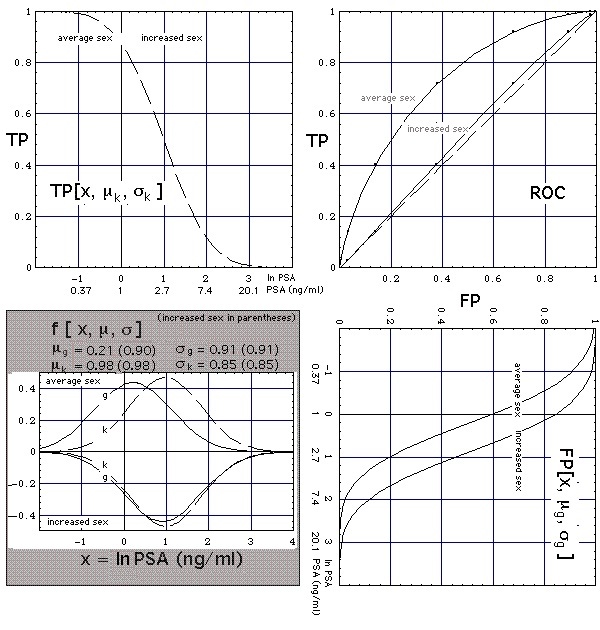 Figure 3b
 Construction of ROC curve (upper right corner) from normal-distributed natural logarithms of PSA concentrations (f curves in shaded area, g means "without cancer", k means "with cancer"). Grey numbers on ROC curve are the PSA thresholds (units: ng/mL), numbers above the ROC curve give the thresholds for the average population, numbers below specify the thresholds for the subpopulation with increaed sexual activity (
Notation).
Parameters used:
The ROC for the subpopulation is virtually identical with the diagonal (dashed line in the ROC diagram of Fig. 3b). Subpopulations with high total PSA concentration (> 10 ng/mL) tend to have g and k distributions like these ones for the subpopulation with increased sex, as their PSA tests have a low performance, meaning their specificity-sensitivity ranges (black horizontal lines at sensitivities 0.9 and 0.95 in Figure lognormal b) touch the diagonal. Only when more Pca specific parameters are considered as well, like in an Artificial Neuronal Network or a nomogram, will the test performance increase (colored horizontal lines at sensitivities 0.9 and 0.95) because the distributions of the healthy and the ill move apart.
Result: In this -more probable- of the two alternatives, the PSA test has no discriminatory power for the subpopulation with increased sexual activity: In the PSA test increased sexual activity presents itself very much like cancer.
Tentative Model
The concentrations of all chemical forms of PSA in the prostate are many orders of magnitude higher than in blood. Let us assume that
- a blood-prostate barrier maintains this concentration step, and
- elevated tPSA concentrations in blood result from a lowered blood-prostate barrier,
then prostate cancer and elevated sexual activity both lower the blood-prostate barrier to a similar extent.
If still other parameters, e.g. mechanical stress of a different kind or infections, similarly lower the blood-prostate barrier, the discriminatory power of the tPSA test tends to disappear at elevated tPSA concentrations. This is what Stephan et al., 2008 (in cache) found.
Version: 11. March 2010
URL
Lymenet Literature Home
Joachim Gruber