(im Cache)
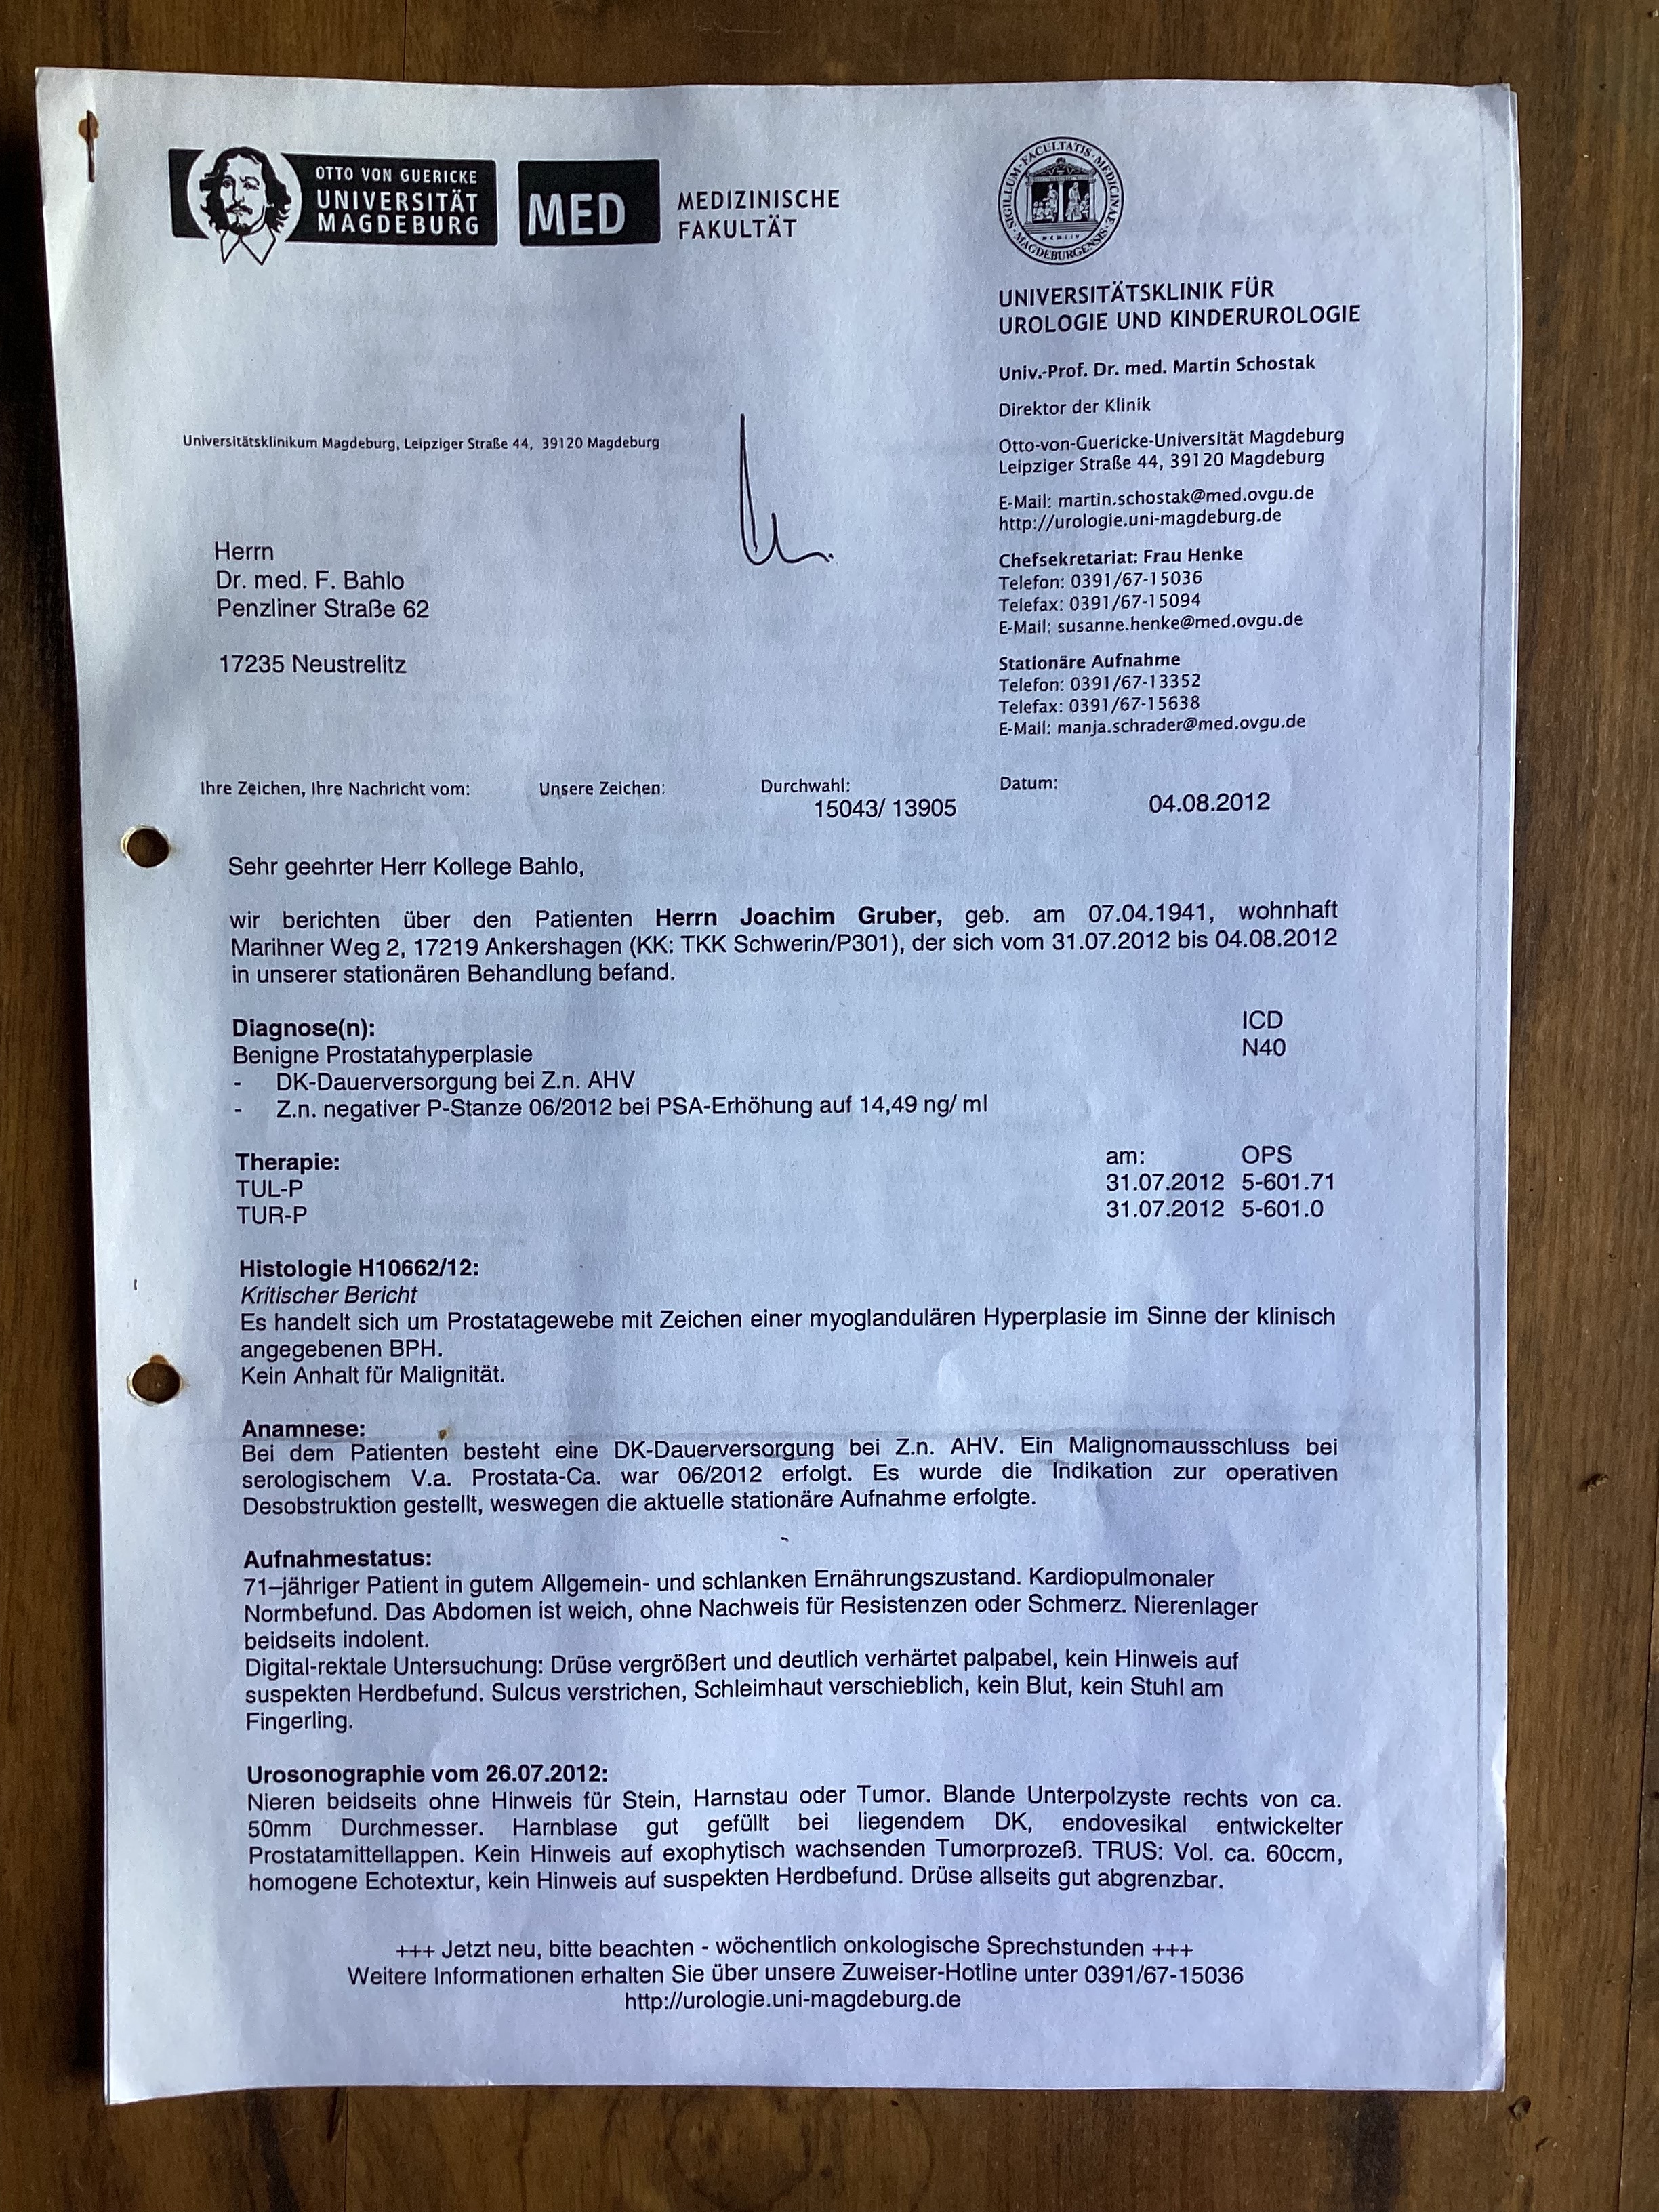
Datum des Abschlussberichts: 4.8.2012
Diagnosis
Benign Prostate Hyperplasia (ICD N40)
- permanent catheter in long-term application after acute urinary retention,
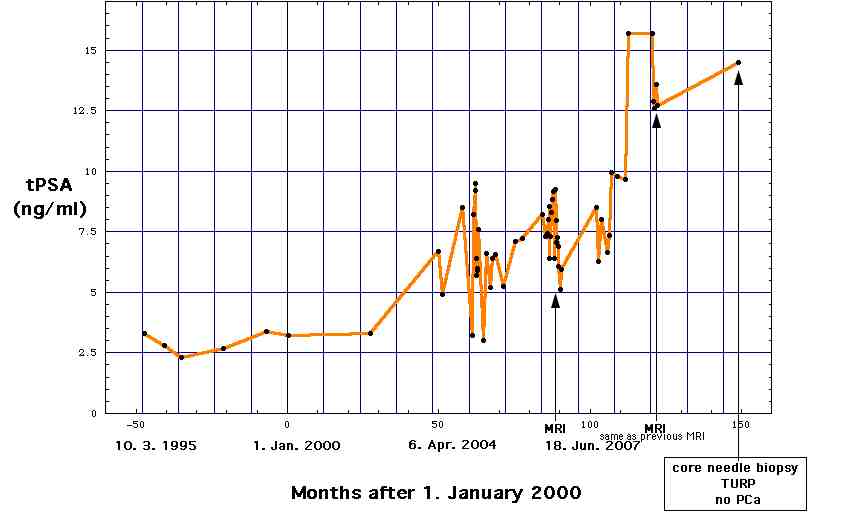
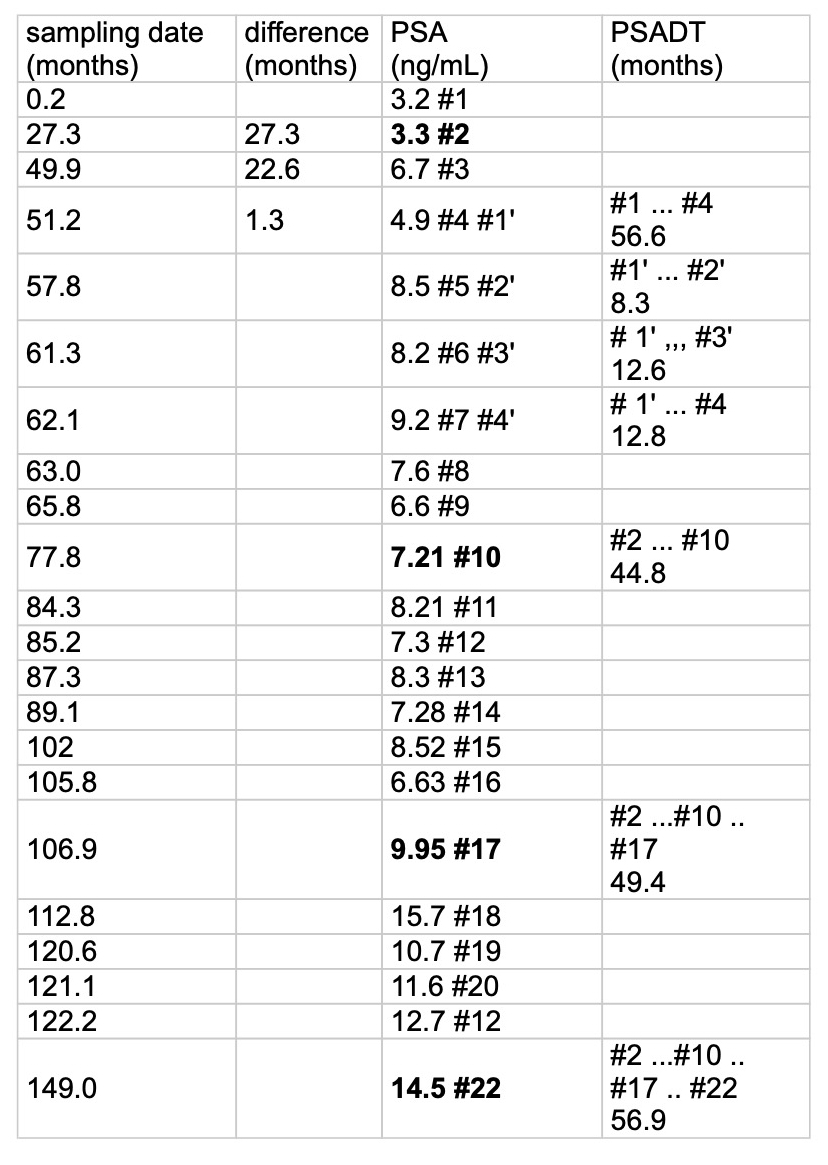
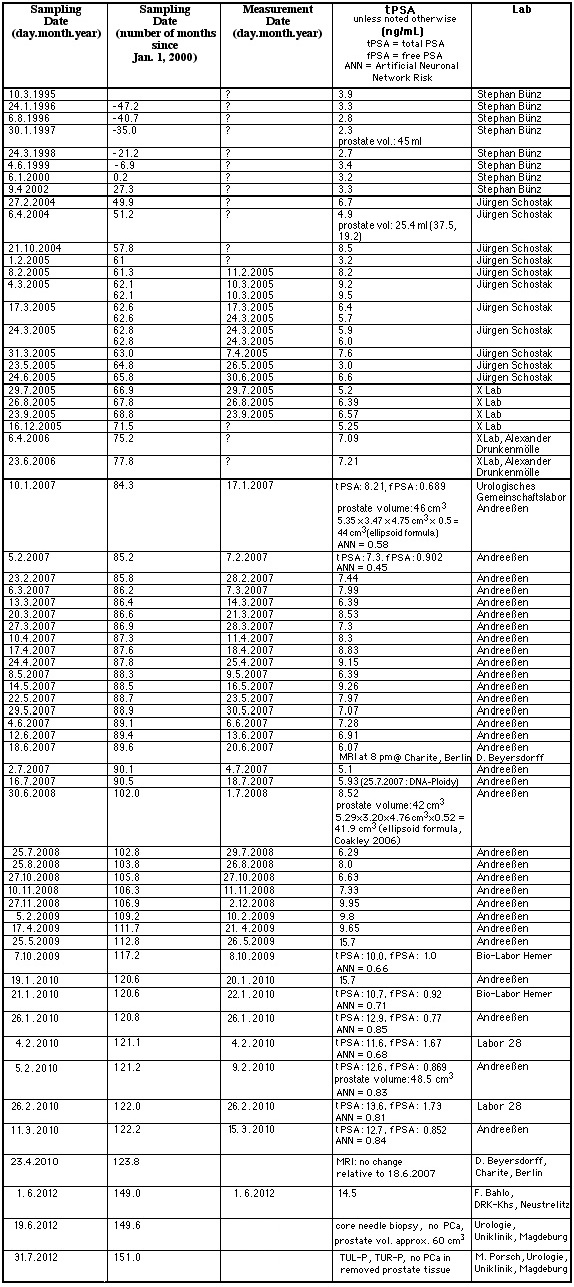
- negative prostate core needle biopsy in June 2012, PSA = 14.5 ng/ml.
|
Diagnose
Benigne Prostatahyperplasie (ICD N40)
|
Therapy
- TUL-P (laser evaporation of prostate tissue, OPS 5-601.71) on July 31, 2012,
- TUR-P (transurethral excision and destruction of prostate tissue, OPS 5-601.71) on July 31, 2012.
|
Therapie
-
TUL-P (transurethrale Laservaporisation der Prostata, OPS 5-601.71) am 31.7.2012,
- TUR-P (transurethrale Resektion der Prostata, OPS 5-601.71) am 31.7.2012.
|
Histology H10662/12
- Prostate tissue with signs of a myoglandolar hyperplasia (clinical diagnosis: BPH).
- No signs of malignancy.
|
Histologie H10662/12
- Es handelt sich um Prostatgewebe mit Zeichen einer myoglandulären Hyperplasie im Sinne der klinisch angegebenen BPH.
- Kein Anhalt für Malignität.
|
Anamnesis
Patient has permanent catheter long-term application after acute urinary retention. Serologic suspected prostate carcinoma (PSA = 14.5 ng/ml). Malignancy was excluded in June 2012 (core needle biopsy). On these grounds operative desobstruction during hospitalization was indicated.
|
Anamnese
Bei dem Patienten besteht eine DK-Dauerversorgung bei Z.n. AHV [akuter Harnverhalt am 29.5.2012 mit Harnvolumen = 1.5 Liter]. Ein Malignomausschluss bei serologischem Verdacht auf Prostata-Carcinom war im Juni 2012 erfolgt. Es wurde die Indikation zur operativen Desobstruktion gestellt, weswegen die aktuelle stationäre Aufnahme erfolgte.
|
Status on entry into hospital
- 71 year old patient in good general health and lean nutritional condition. Normal cardiopulmonary findings. Abdomen is soft, without evidence of resistance or pain. Kidneys indolent on both sides.
- Digital Rectal Exam: prostate enlarged and clearly hardened palpable, no signs for suspect focal leasions. Sulcus shallow, mucosa relocatable, no blood, no faeces on thimble
- Urosonography on July 26, 2012: kidneys on both sides without signs of stone, obstruction of urinary flow or tumor. Bland lower pole cyst on right side, 50 mm in diameter. Bladder well filled with permanent catheter in place, endovesically protruding prostate medium lobe. No sign for exophytic tumor process.
TRUS: prostate volume appr. 60 ml, homogeneous echo texture, no sign of suspect focal leasons, prostate on all sides well defined.
|
Aufnahmestatus
|
Therapy and results
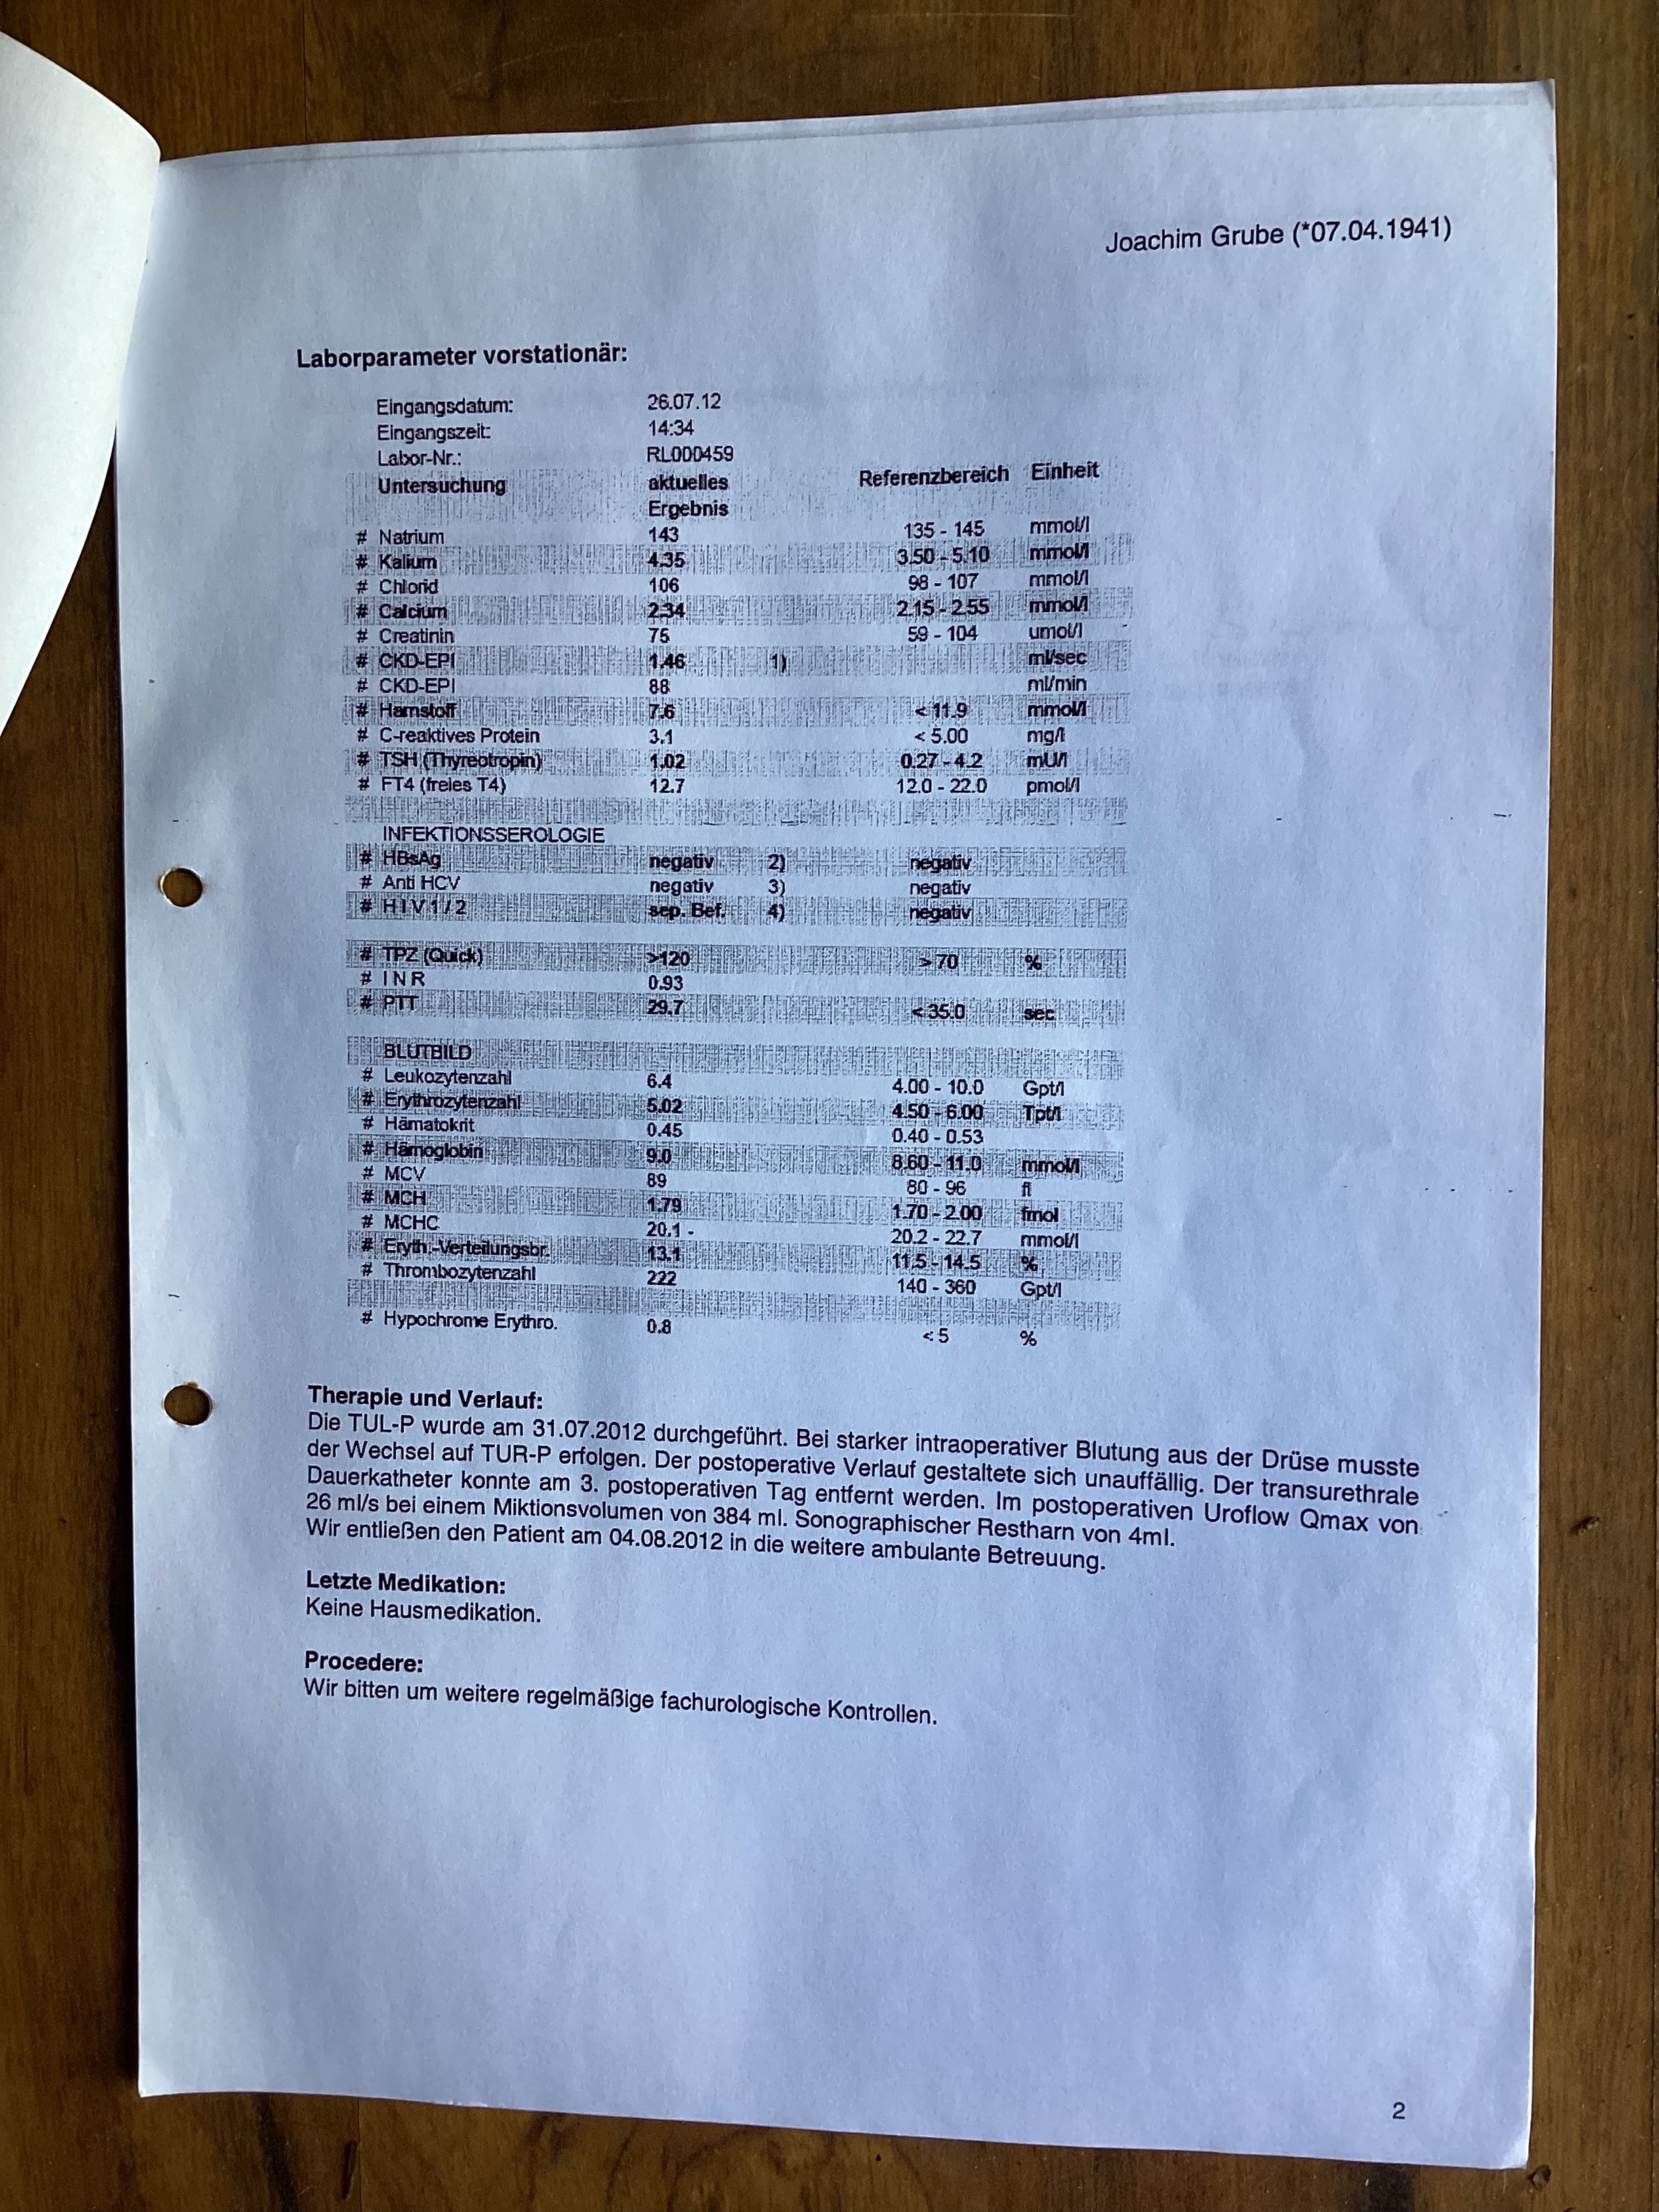
TUL-P done on July 31, 2012. Because of heavy prostate bleeding, surgery had to switch to TUR-P. Postoperative progress without complications. Transurethral permanent catheter could be removed on 3. day after surgery. Urinary flow on 4. day after surgery: Qmax = 26 ml/sec, urin volume 384 ml. Residual urinary volume on sonography: 4 ml.
(Translation used dictionary of medical terms)
|
Therapie und Verlauf
Die TUL-P wurde am 31.7.2012 durchgeführt. Bei starker intraoperativer Blutung aus der Drüse mußte der Wechsel auf TUR-P erfolgen. Der postoperative Verlauf gestaltete sich unaufffällig. Der transurethrale Dauerkatheter konnte am 3. postoperativen Tag entfernt werden. Im postoperativen Uroflow war Qmax = 26 ml/sec bei einem Miktionsvolumen = 384 ml. Sonographisches Restharnvolumen = 4 ml.
|
Quelle:
Universitätsklinik Düsseldorf, Heinrich-Heine-Universität Düsseldorf
| Parameter | Einheit | Faktor | Einheit |
| ACTH | pg/ml | x 0,2202 = | pmol/l |
| Adrenalin | ng/24h | x 5,46 = | pmol/d |
| AFP | ng/ml | x 0,83 = | U/ml |
| Albumin | g/dl | x 144,93 = | µmol/l |
| Aldosteron | ng/l | x 2,77 = | pmol/l |
| Ammoniak | µg/dl | x 0,58 = | µmol/l |
| Androstendion | ng/ml | x 0,0349 = | nmol/l |
| Äthanol | mg/dl | x 6,915 = | µmol/l |
| b-OH-Butyrat | mg/dl | x 96,05 = | µmol/l |
| Bilirubin | mg/dl | x 17,104 = | µmol/l |
| Blei | µg/l | x 0,004826 = | µmol/l |
| Calcium | mmol/l | x 4,008 = | mg/dl |
| Calcitonin | ng/l | x 0,28 = | pmol/l |
| Chlorid | mmol/l | x 3,5453 = | mg/dl |
| Cholesterin | mg/dl | x 0,0259 = | mmol/l |
| Cortisol | µg/l | x 2,76 = | nmol/l |
| Creatin | mg/dl | x 76,254 = | µmol/l |
| C-Peptid | µg/l | x 0,33 = | nmol/l |
| DHEA-S | µg/l | x 0,0025 = | µmol/l |
| Eisen | µmol/l | x 5,5847 = | µg/dl |
| EBK | µmol/l | x 5,5847 = | µg/dl |
| Fett im Stuhl | g/die | x 3,515 = | mmol/l |
| Fibrinogen | g/dl | x 29,41 = | µmol/l |
| Folsäure | ng/ml | x 2,266 = | nmol/l |
| Glucagon | ng/l | x 0,2869 = | pmol/l |
| Glukose | mg/dl | x 0,05551= | mmol/l |
| Hämoglobin | g/dl | x 0,6206 = | mmol/l |
| Harnsäure | mg/dl | x 59,485 = | µmol/l |
| Harnstoff | mg/dl | x 0,1665 = | mmol/l |
| 5-HIES | mg/l | x 5,23 = | µmol/l |
| HPL | mg/l | x 46,3 = | nmol/l |
| 17-OH-Steroide | mg/die | x 2,759 = | µmol/l |
| Insulin | mU/l | x 7,2141 = | pmol/l |
| Kalium | mmol/l | x 3,9102 = | mg/dl |
| 17-Ketosteroide | mg/die | x 3,467 = | µmol/die |
| Kreatinin | mg/dl | x 88,4 = | µmol/l |
| Kupfer | µmol/l | x 6,3546 = | µg/dl |
| Lactat | mmol/l | x 9,008 = | mg/dl |
| Lithium | mmol/l | x 0,693 = | mg/dl |
| Magnesium | mmol/l | x 2,4312 = | mg/dl |
| Metanephrine | mg/die | x 5,458 = | µmol/l |
| b 2-Mikroglobulin | mg/l | x 84,75 = | nmol/l |
| Myoglobin | mg/dl | x 0,585 = | µmol/l |
| Natrium | mmol/l | x 2,2989 = | mg/dl |
| Noradrenalin | µg/24h | x 5,91 = | nmol/14h |
| Östradiol | ng/l | x 3,671 = | pmol/l |
| Östriol | µg/l | x 3,47 = | nmol/l |
| Parathormon | ng/l | x 0,106 = | pmol/l |
| Phosphor anorg. | mmol/l | x 3,0974 = | mgP/dl |
| Phospholipide | mg/dl | x 0,0129 = | mmol/l |
| pO2, pCO2 | mmHg | x 0,1333 = | kPa |
| Porphobilinogen | mg/24h | x 4,42 = | µmol/d |
| Pregnantriol | mg/14h | x 2,972 = | µmol/d |
| Prolactin | ng/ml | x 27,6 = | mU/ml |
| Progesteron | ng/ml | x 3,18 = | nmol/l |
| 17-OH-Progesteron | ng/ml | x 3,026 = | nmol/l |
| Pyruvat | µmol/l | x 0,0088 = | mg/dl |
| T3 | µg/l | x 1,54 = | nmol/l |
| T4 | µg/l | x 1,287 = | nmol/l |
| FT4 | µg/l | x 1,287 = | pmol/l |
| TBG | mg/l | x 17(12,87) = | nmol/l |
| Testosteron | ng/ml | x 3,467 = | nmol/l |
| Triglyceride | mg/dl | x 0,0114 = | mmol/l |
| Vitamin A | mg/l | x 0,03491 = | µmol/l |
| Vitamin B2 | µg/dl | x 26,57 = | nmol/l |
| Vitamin B6 | ng/ml | x 5,982 = | nmol/l |
| Vitamin B12 | pg/ml | x 0,7378 = | pmol/l |
| 25-OH-Vitamin D3 | ng/ml | x 2,496 = | nmol/l |
| Vitamin C | mg/l | x 5,6776 = | µmol/l |
| Vitamin E | mg/dl | x 23,22 = | µmol/l |
| VMS | mg/die | x 5,046 = | µmol/die |
| D-Xylose | mg/dl | x 0,0666 = | mmol/l |
| Zink | µg/dl | x 0,153 = | µmol/l |
AP, GPT, GOT,
GGT, Amylase, | U/l | x 16,67 =
x 0,01667 = | nkat/l
µkat/l |
Version: 25.4.2026
Address of this page
Home
Joachim Gruber
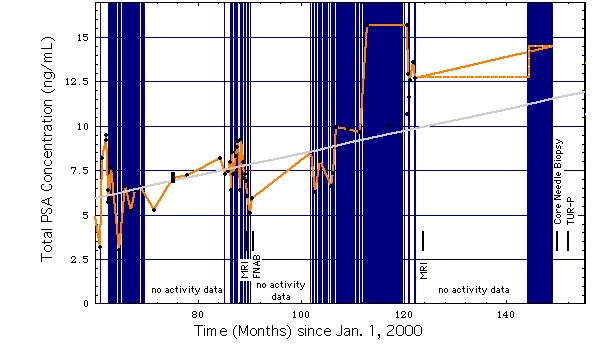
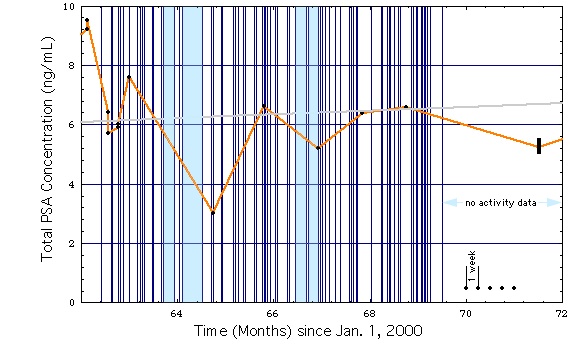
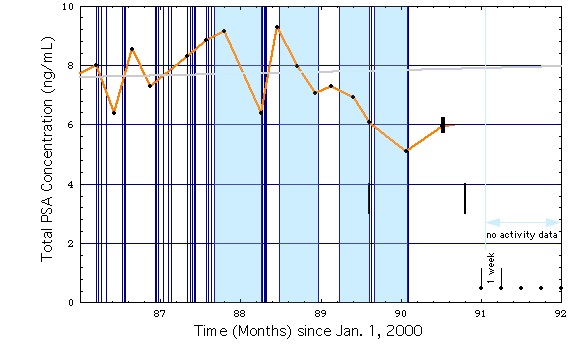
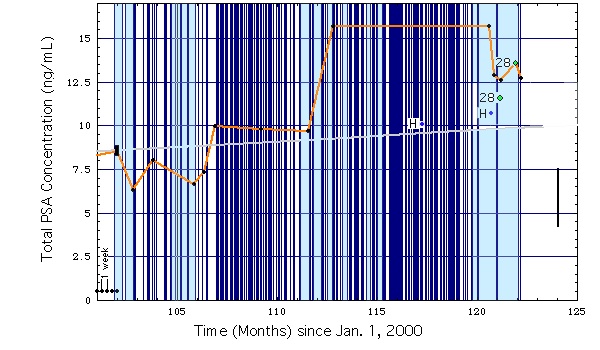 Fig. 1d